Data Dashboard
The Data Dashboard is the data surface for the platform. It's where analysts, clinicians and product managers work with the records your product is producing.
https://dashboard.sandbox.ovok.comWhat the Data Dashboard is for
- Inspect records — patients, encounters, observations, care plans, diagnostic reports. Read the same FHIR your API serves, with a human-friendly UI on top.
- Validate workflows — confirm that a clinical pathway wrote the resources you expected, in the shape you expected.
- Curate cohorts — segment patients by condition, plan, or any searchable FHIR property.
- Export & investigate — pull a slice of data for analysis or share a snapshot with a partner.
When to use it
- Triaging a support ticket: "this patient's record looks wrong."
- Running a clinical audit before a release goes to production.
- Building a cohort for a research export.
- Sanity-checking that an integration is writing the right resources.
Console or Data Dashboard?
| You want to... | Surface |
|---|---|
| Add a teammate to your project | Console |
| Look up a patient's last visit | Data Dashboard |
| Update billing details | Console |
| Confirm an observation was recorded | Data Dashboard |
| Rotate an API key | Console |
| Curate a cohort for analytics | Data Dashboard |
The two surfaces speak to the same API. Anything you can see in the Data Dashboard, your code can read; anything you configure in the Console, your code can manage.
Where to find it
| Tier | Host |
|---|---|
| alpha | dashboard.dev.ovok.com |
| beta | dashboard.staging.ovok.com |
| final | dashboard.ovok.com |
The link in the navbar above always goes to the final Data Dashboard. Switch the release tier in the env switcher to use the matching Dashboard for the same maturity tier.
Guided tour
The Data Dashboard is a thin admin layer over the same FHIR server your API talks to (Medplum). Anyone with a project role can sign in and inspect resources.
1. Sign in (two steps)
Open dashboard.sandbox.ovok.com. The sign-in flow is two cards:
- Email card —
Sign Intitle, Email field, Continue button. Submit your account email. - Password card — your email shows in a read-only row (with a pencil icon to change), then a Password field, a Remember me checkbox, and the Sign In button. A Reset Password link sits below.
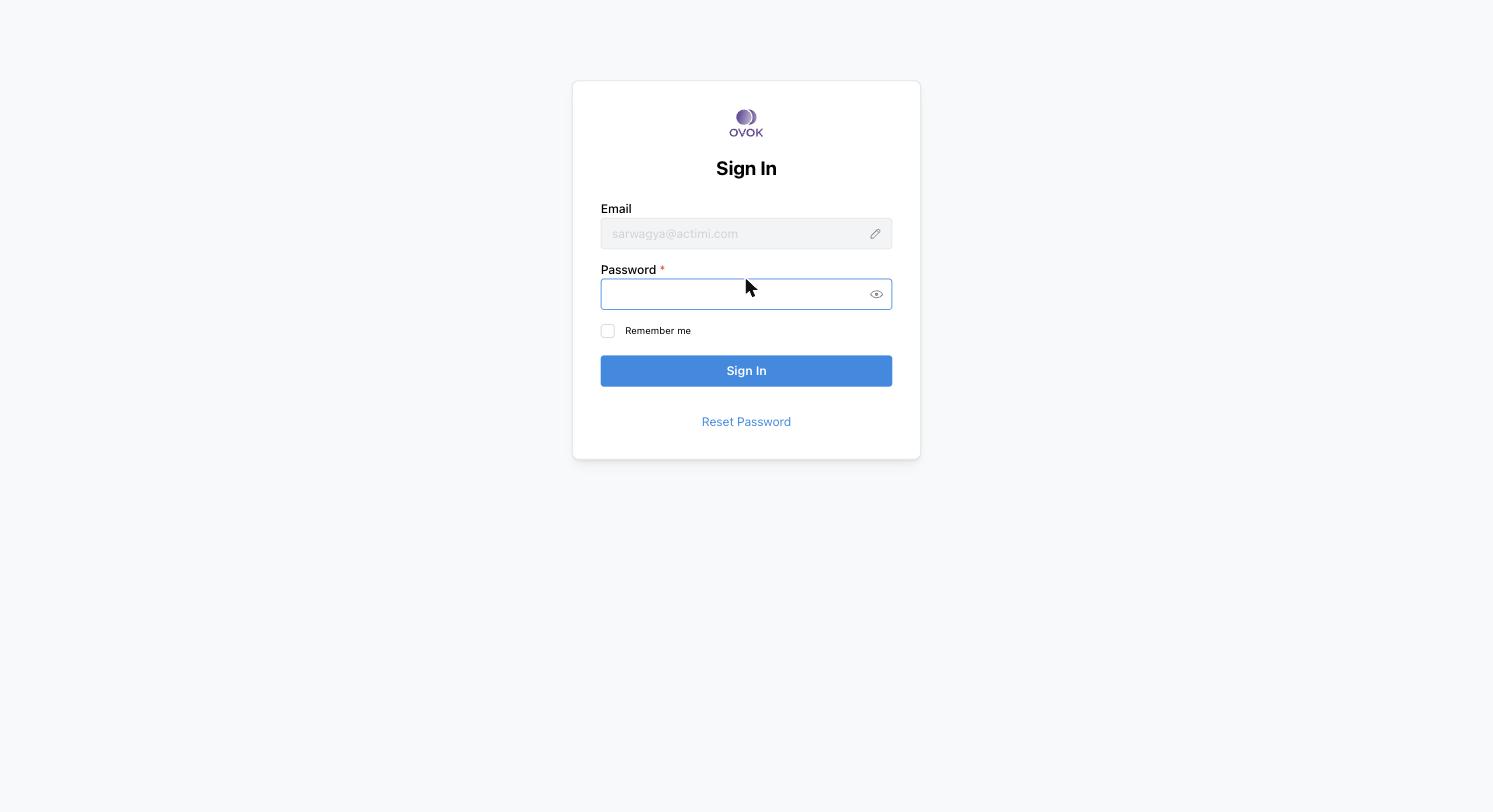
Magic-link / SSO flows surface from the email step when your tenant opts in.
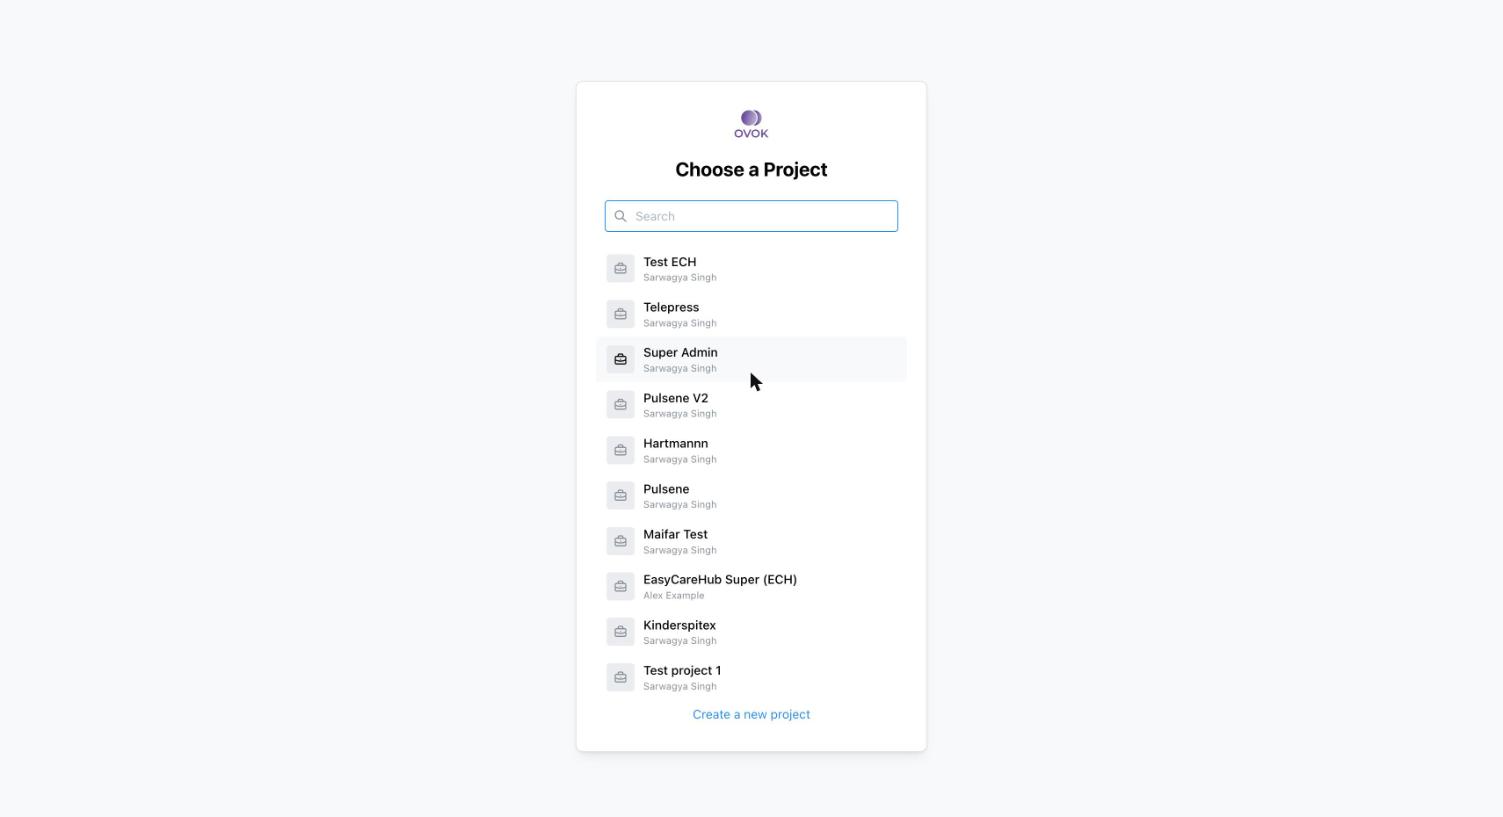
2. Choose a project
After password sign-in, Choose a Project lists every project where your account has a Practitioner or member profile. Each row shows the project name and the owner. A search field filters the list; a Create a new project link at the bottom is admin-only and spins up a fresh project (and its tenant) for you.
3. The resource workspace
You land on /Patient?_count=20&_fields=_lastUpdated,name,birthDate,email,gender&_sort=-_lastUpdated
— a tabular Patient browser. Anatomy:
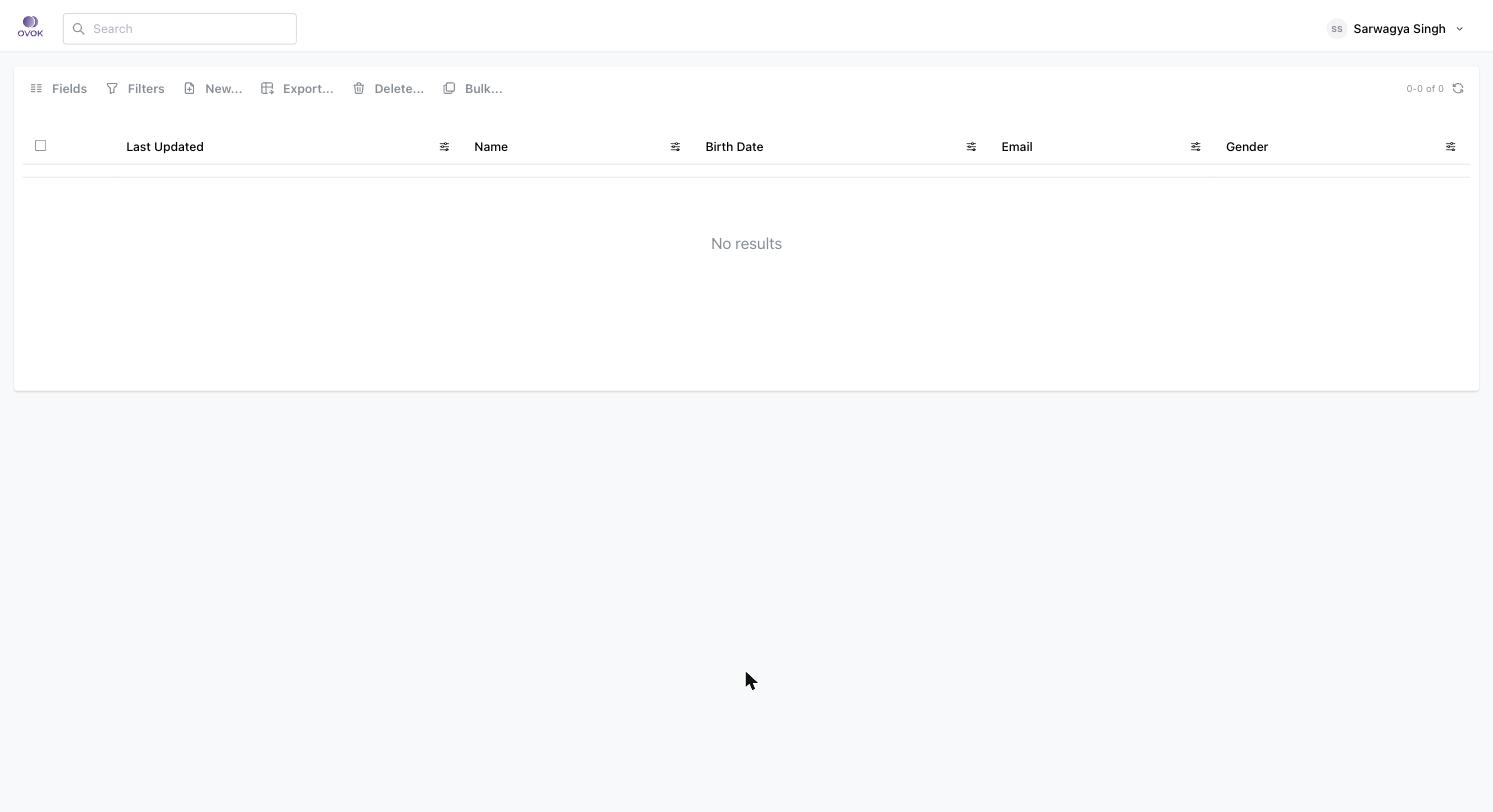
- Top bar — Ovok logo (links home), a search field, profile dropdown.
- Toolbar above the table —
☰ Fields,🔽 Filters,✚ New…,⤓ Export…,🗑 Delete…,❐ Bulk…. Right-aligned: pagination (0-0 of 0) and a refresh icon. - Table — checkbox column, then the FHIR fields you asked for
via
_fields. Click a column header's filter chip to add an inline filter.
Empty state on the table reads "No results".
4. Switching resource types
The URL is the contract. Navigate to any FHIR resource the project
supports by visiting /<ResourceType>:
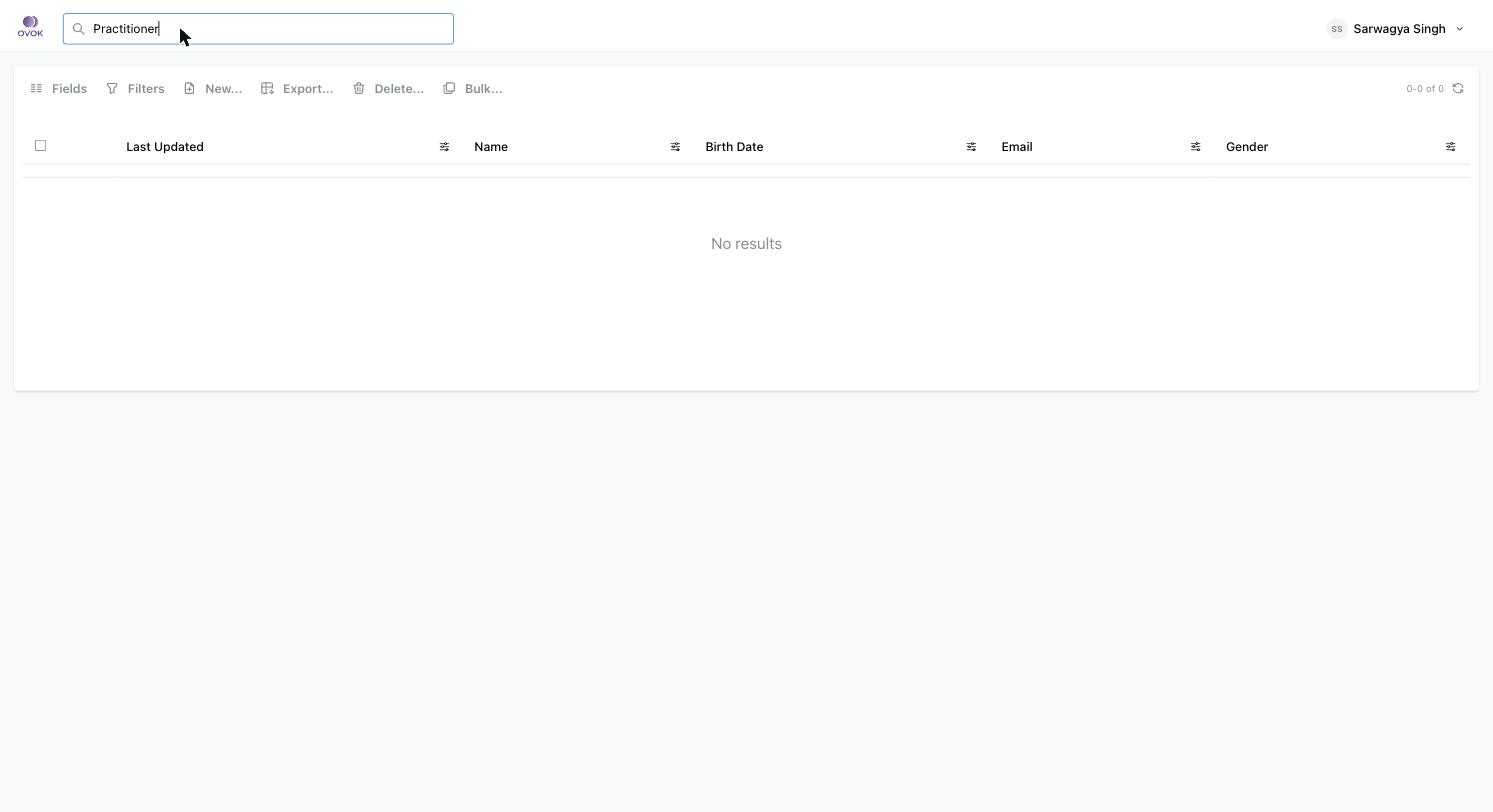
/Patient
/Practitioner
/Encounter
/Observation
/DiagnosticReport
/Communication
/QuestionnaireResponse
/Bundle
…
The view adapts: column defaults come from your project's data shape
and the resource's commonly-searched fields. The same query
parameters (_count, _fields, _sort, _filter, _offset) work
across every resource type — they're the standard FHIR search
parameters.
5. Reading a single resource
Click a row to open /<ResourceType>/<id>. The detail view has
tabs:
- Details — rendered FHIR resource with a human-friendly layout (clinical sections, identifiers, etc.).
- Edit — inline JSON / form editor with validation.
- History — versioned changes; each version is read-only and diffable.
- Blame — who wrote which field, when.
- References — incoming + outgoing references to this resource (e.g. a Patient's Encounters, Observations).
- JSON — raw FHIR JSON.
- XML — raw FHIR XML.
6. Bulk operations
The Bulk… toolbar action accepts a search query and lets you apply an operation (export, delete, patch) across all matching resources. Project admins only. Bulk exports come back as NDJSON in the Files tab.
7. New… (creating resources by hand)
✚ New… opens a guided form derived from the resource's
StructureDefinition. It's the right way to seed test data into a
project without writing code. Fields obey the StructureDefinition's
required / max-cardinality rules and FHIR's value sets.
8. Profile menu
The user dropdown (top right) holds:
- Your active project (with switch link)
- Profile — your Practitioner / Patient resource on this project
- Security — password, sessions, MFA
- Sign out
The same dropdown is how you switch projects without going back to the project picker — same accounts, different tenants.