Ovok Console
The Ovok Console is the operator surface for the platform. It's where your team configures the product behind your product.
https://console.sandbox.ovok.comWhat the Console is for
- Projects — create, rename, archive. Every project is a tenant boundary; resources never cross projects.
- Members & roles — invite operators, assign roles, revoke access.
- Billing — connect Stripe customers, see invoices and line items, toggle billed surfaces on and off.
- Content — edit the copy and assets served inside your product.
- Audit / change history — read who changed what and when.
- Devices & signals — manage the device fleet attached to your project.
When to use it
- Bringing a new operator onto the platform.
- Standing up a fresh project for a new pilot, partner, or product.
- Investigating a change after the fact (audit, billing, content).
If your engineers can do something from the Console, they can do it from the API — the Console is a client of the same surface every integration uses. There's no privileged operator endpoint.
Where to find it
| Tier | Host |
|---|---|
| alpha | console.dev.ovok.com |
| beta | console.staging.ovok.com |
| final | console.ovok.com |
The link in the navbar above always goes to the final Console. Switch the tier in the env switcher to use the matching Console for the same maturity tier.
Guided tour
A click-by-click walk through the Console as it stands today. Tier
labels in the URL (console.sandbox.ovok.com) shift with the env
switcher; everything else looks the same.
1. Sign in
Open console.sandbox.ovok.com. The landing page is the Welcome
back. sign-in card.
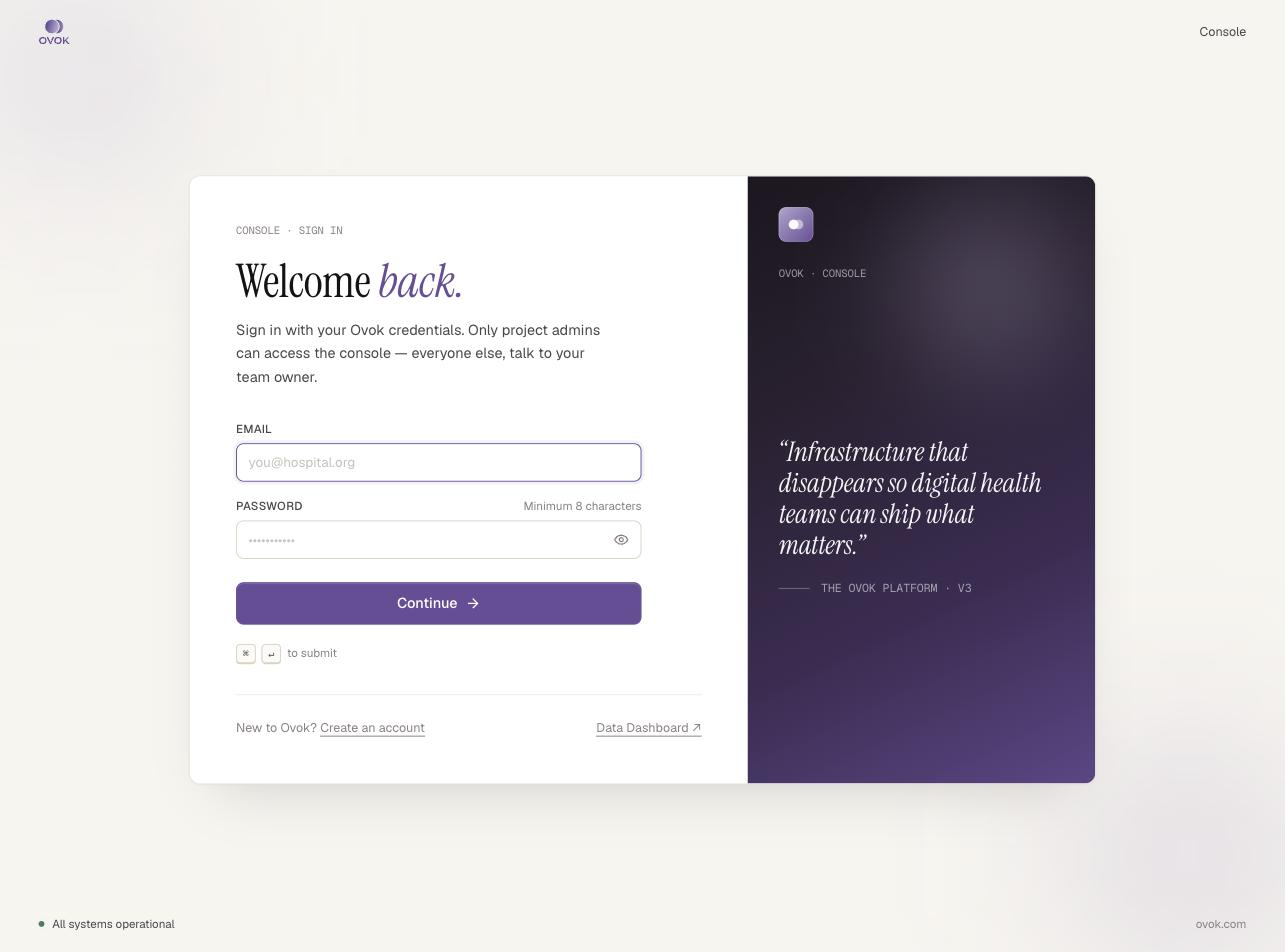
- Email field — your Ovok account email
- Password field — minimum 8 characters
- Continue → button (or press
⌘ ↵/Ctrl ↵)
Foot text: "Sign in with your Ovok credentials. Only project admins can access the console — everyone else, talk to your team owner." A Data Dashboard link in the bottom-right of the card opens the data surface directly.
System status (e.g. ● All systems operational) sits in the page
footer. If it's red, sign-in may still work but expect degraded
functionality.
2. Pick a project
After sign-in, the Step 2 · Pick a project card lists every project your account can administer. Each row shows a project icon, display name, and slug:
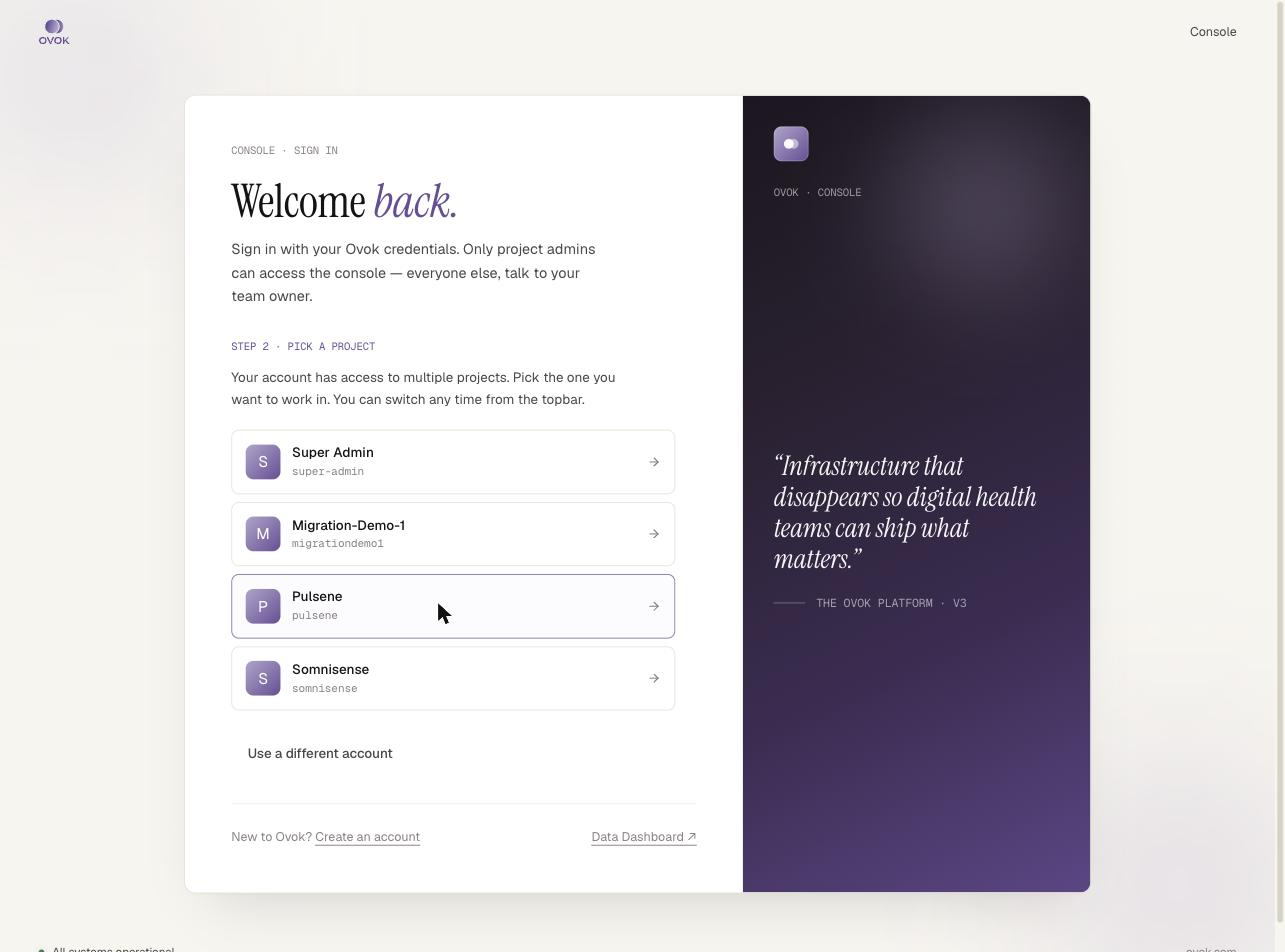
Super Admin           super-admin
Migration-Demo-1      migrationdemo1
Pulsene               pulsene
Somnisense            somnisense
Click a row to enter that project. Use a different account at the bottom signs you out.
3. Project Overview
/overview is the dashboard for the picked project. Anatomy:
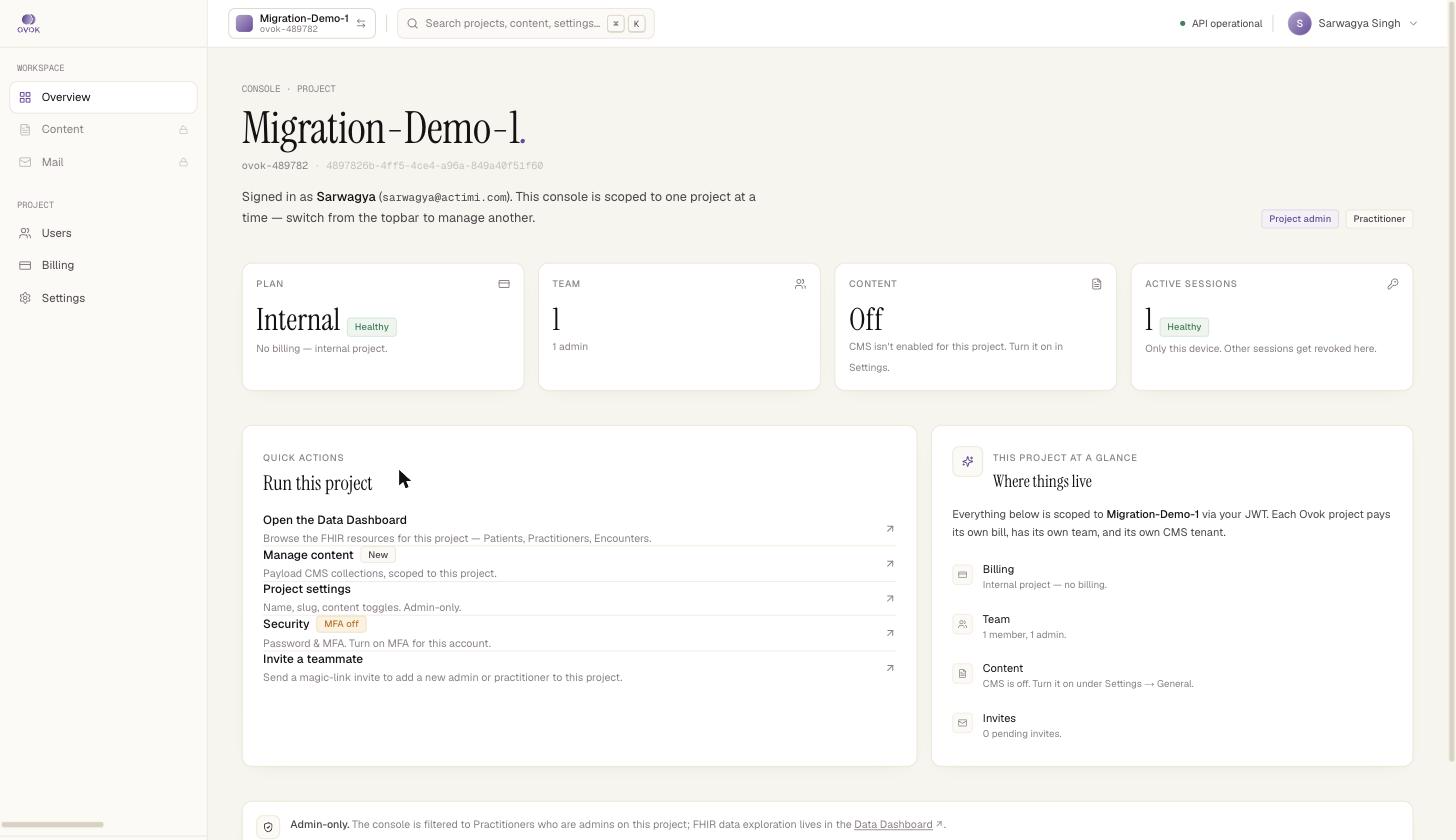
- Top bar — project switcher (project name + slug + arrow icon),
global search (
⌘K), API status pill, profile dropdown. - Left sidebar — Workspace (Overview, Content, Mail) and Project (Users, Billing, Settings). Workspace items show a lock icon when the underlying feature is disabled for the project.
- Page header — large project name, slug + Medplum project ID,
one-line "Signed in as…" attribution, and role badges
(
Project admin,Practitioner).
Four stat cards line the top of the body:
| Card | What it shows |
|---|---|
| PLAN | Subscription plan (e.g. Internal) and health badge. Subtext: "No billing — internal project" for internal-only projects. |
| TEAM | Member count and admin count. |
| CONTENT | CMS state. Off here means "CMS isn't enabled for this project. Turn it on in Settings." |
| ACTIVE SESSIONS | Sessions for the current account. Subtext: "Only this device. Other sessions get revoked here." |
Below the cards, two columns:
- Quick actions · Run this project — shortcut links to the Data Dashboard, content management, project settings, security, and invites.
- This project at a glance · Where things live — sidebar-style index pointing at Billing, Team, Content, Invites. Each row has a one-liner status (e.g. "CMS is off. Turn it on under Settings → General.").
A footer note reads: "Admin-only. The console is filtered to Practitioners who are admins on this project; FHIR data exploration lives in the Data Dashboard."
4. Settings → Overview
From the left sidebar, click Settings. The default tab is Overview, which surfaces two read-only cards:
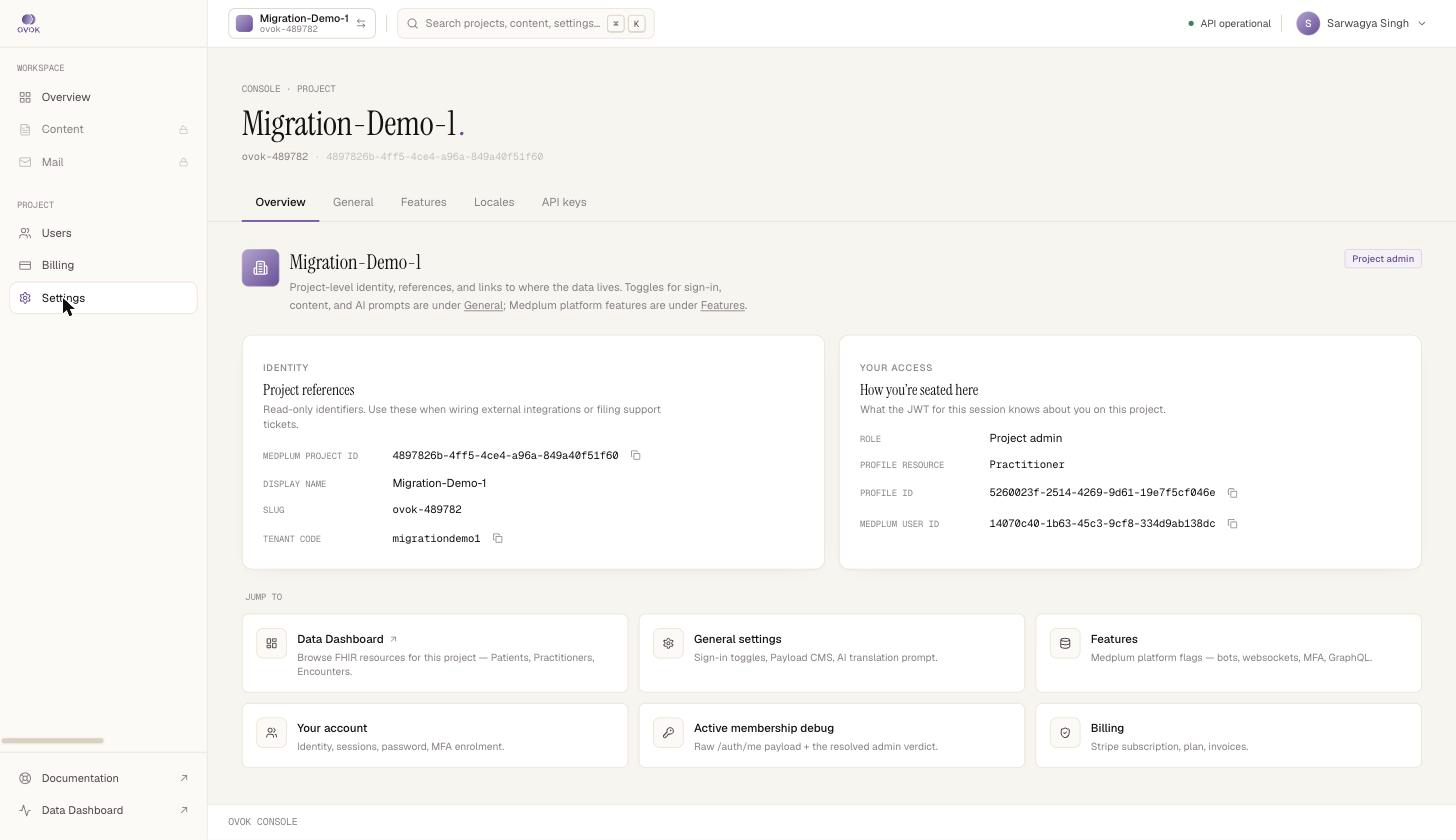
- Identity · Project references — Medplum Project ID, Display Name, Slug, Tenant Code. Each value has a copy-to-clipboard icon.
- Your access · How you're seated here — Role, Profile resource type, Profile ID, Medplum User ID.
A Jump to grid at the bottom links to: Data Dashboard, General settings, Features, Your account, Active membership debug, Billing.
Other Settings tabs: Overview · General · Features · Locales · API keys.
5. Settings → General
Where you flip per-project feature toggles. The page is a stack of section cards; each card has an eyebrow, title, description, a labeled toggle, and the underlying config key in monospace.
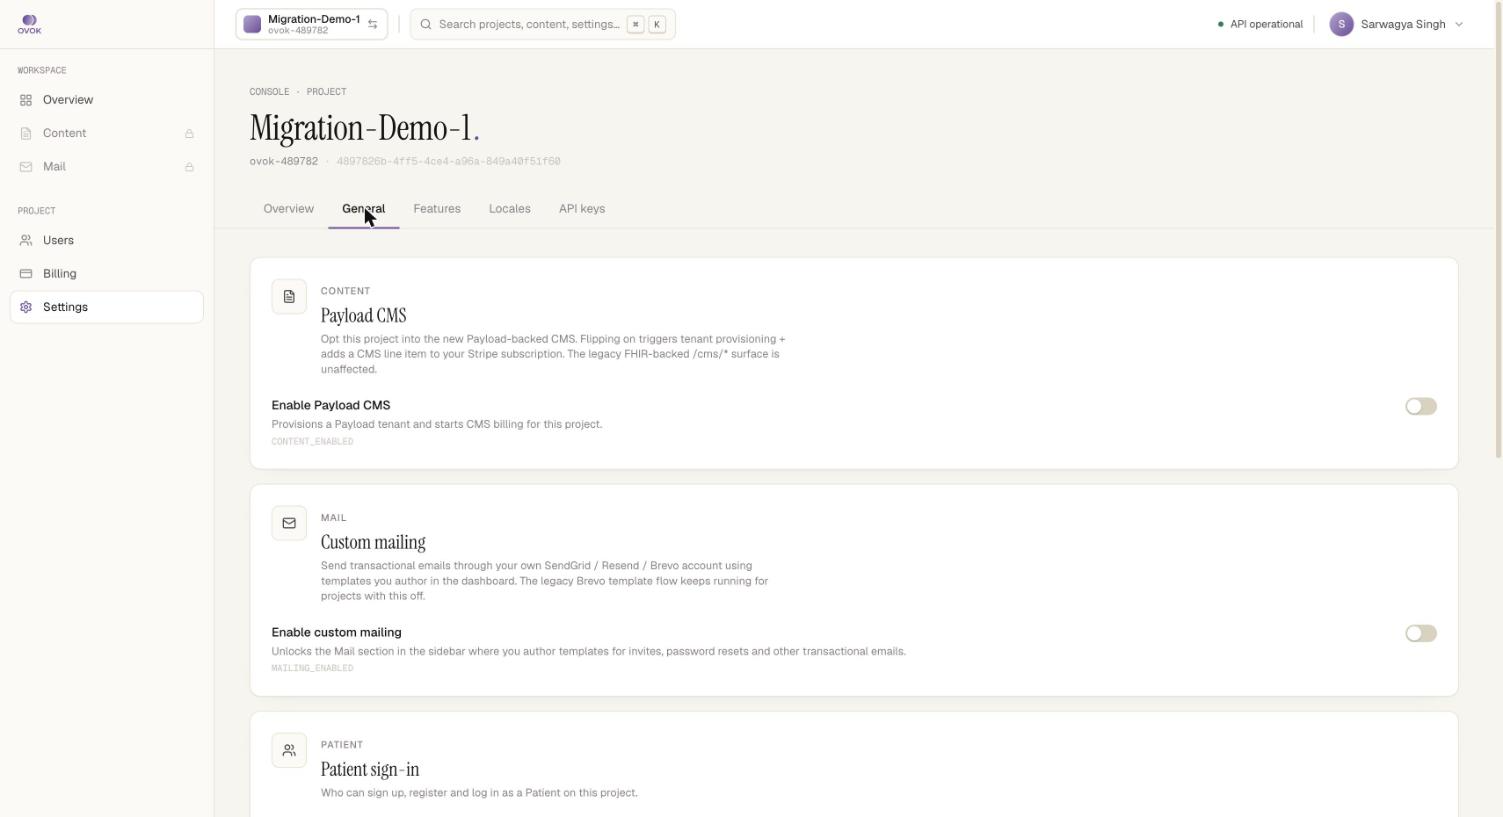
Content section — Payload CMS
Opt this project into the new Payload-backed CMS. Flipping on triggers tenant provisioning + adds a CMS line item to your Stripe subscription. The legacy FHIR-backed
/cms/*surface is unaffected.Enable Payload CMS — Provisions a Payload tenant and starts CMS billing for this project. (
CONTENT_ENABLED)
Mail section — Custom mailing
Send transactional emails through your own SendGrid / Resend / Brevo account using templates you author in the dashboard. The legacy Brevo template flow keeps running for projects with this off.
Enable custom mailing — Unlocks the Mail section in the sidebar where you author templates for invites, password resets and other transactional emails. (
MAILING_ENABLED)
Below those: Patient sign-in and other toggles per the project's feature surface.
See Enable CMS for the full step-by-step on the Payload CMS toggle.
6. Settings → API keys
This is the CMS API keys screen. Eyebrow "PUBLIC DELIVERY", title "CMS API keys".
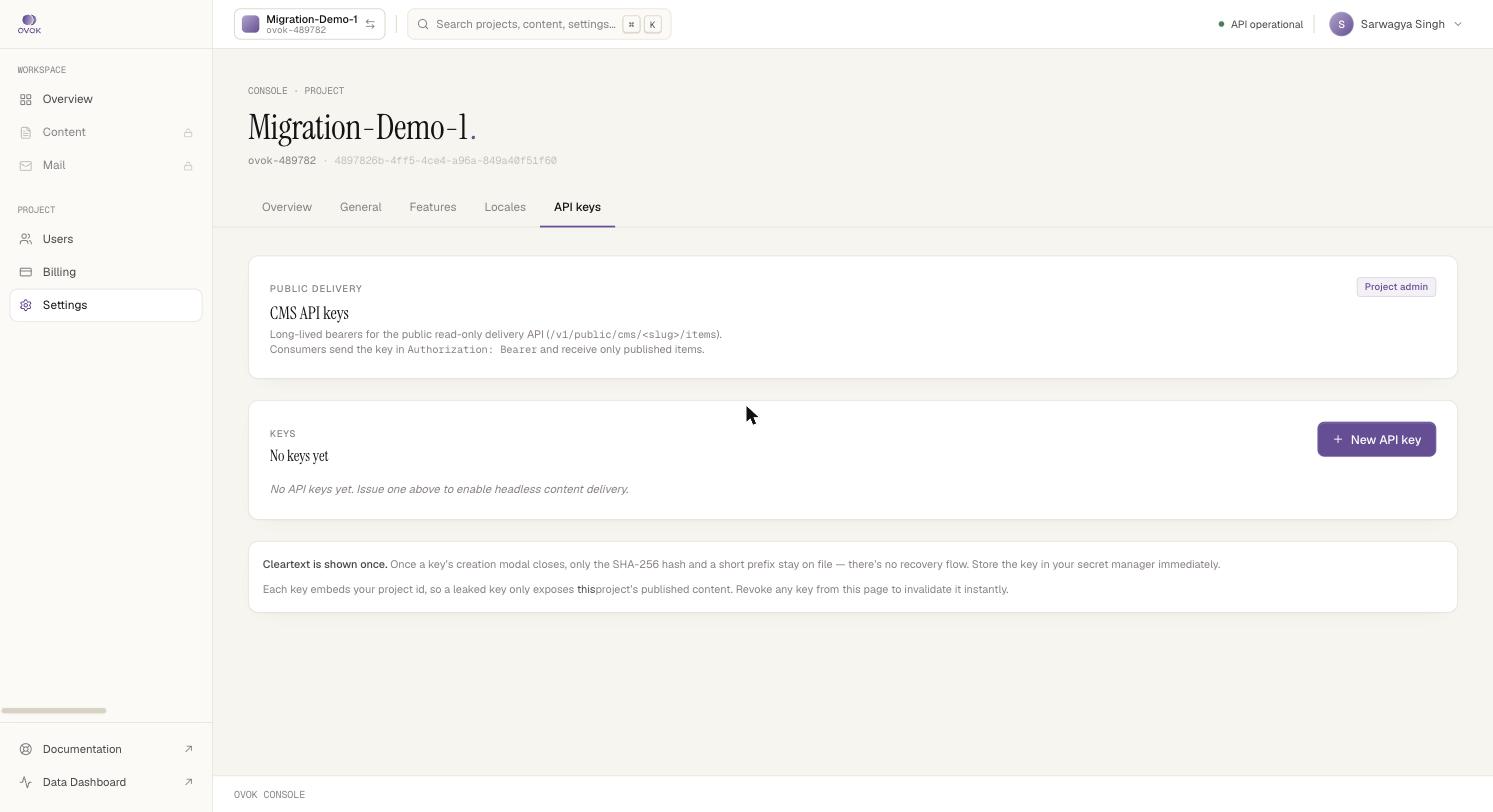
Long-lived bearers for the public read-only delivery API (
/v1/public/cms/<slug>/items). Consumers send the key inAuthorization: Bearerand receive only published items.
A second card lists the keys (empty state: "No keys yet — No API keys yet. Issue one above to enable headless content delivery.") and exposes the + New API key action.
Below the table, two disclaimers:
Cleartext is shown once. Once a key's creation modal closes, only the SHA-256 hash and a short prefix stay on file — there's no recovery flow. Store the key in your secret manager immediately.
Each key embeds your project id, so a leaked key only exposes this project's published content. Revoke any key from this page to invalidate it instantly.
See CMS API keys for the full mint / rotate / scope guide.
7. Content (Workspace)
/content is gated by the CMS toggle. With CMS off, the page is a
single card:
PAYLOAD CMS · OFF
Enable the CMS for this project
Payload CMS lets your team manage posts, media and other project-specific content from this console. Flipping it on provisions a Payload tenant for this project and adds a CMS line item to your Stripe subscription.
[Open project settings →] [What is Payload CMS?]
After enabling, this becomes the editorial surface — collections, media library, drafts, publishing — scoped to the project's Payload tenant.
8. Project sidebar (always-on)
- Users — invite, list, suspend, change roles
- Billing — Stripe subscription, plan, invoices
- Settings — the tab cluster covered above
A footer in the sidebar links to Documentation (this site) and the Data Dashboard (the same surface tier).
Looking for the data side?
If you need to inspect records, curate cohorts, or validate the data your product produces, head to the Data Dashboard instead. The two surfaces complement each other — Console runs the platform, Data Dashboard reads the data.